Industrial data.Connected.
CAD, business systems and Excel. One platform to find projects, compare costs and put the factory’s memory to work.
switchgear assemblies documented in CAD
DWG sheets per assembly
management-system records
historical Excel records
Manufacturing data, finally connected.
At ICEL, years of production knowledge were spread across CAD drawings, business systems, Excel files and local archives. Sales needed references for quotes, engineering needed comparable projects and R&D wanted to explore past work. We built a common foundation to reconnect this information.
- Data engineering
- CAD / DWG
- Databases & APIs
Inside the platform.
Explore the archive, narrow the search, compare quantities and costs. A redesigned interface following the original project’s data and workflow.
Industrial memory. Ready to explore.
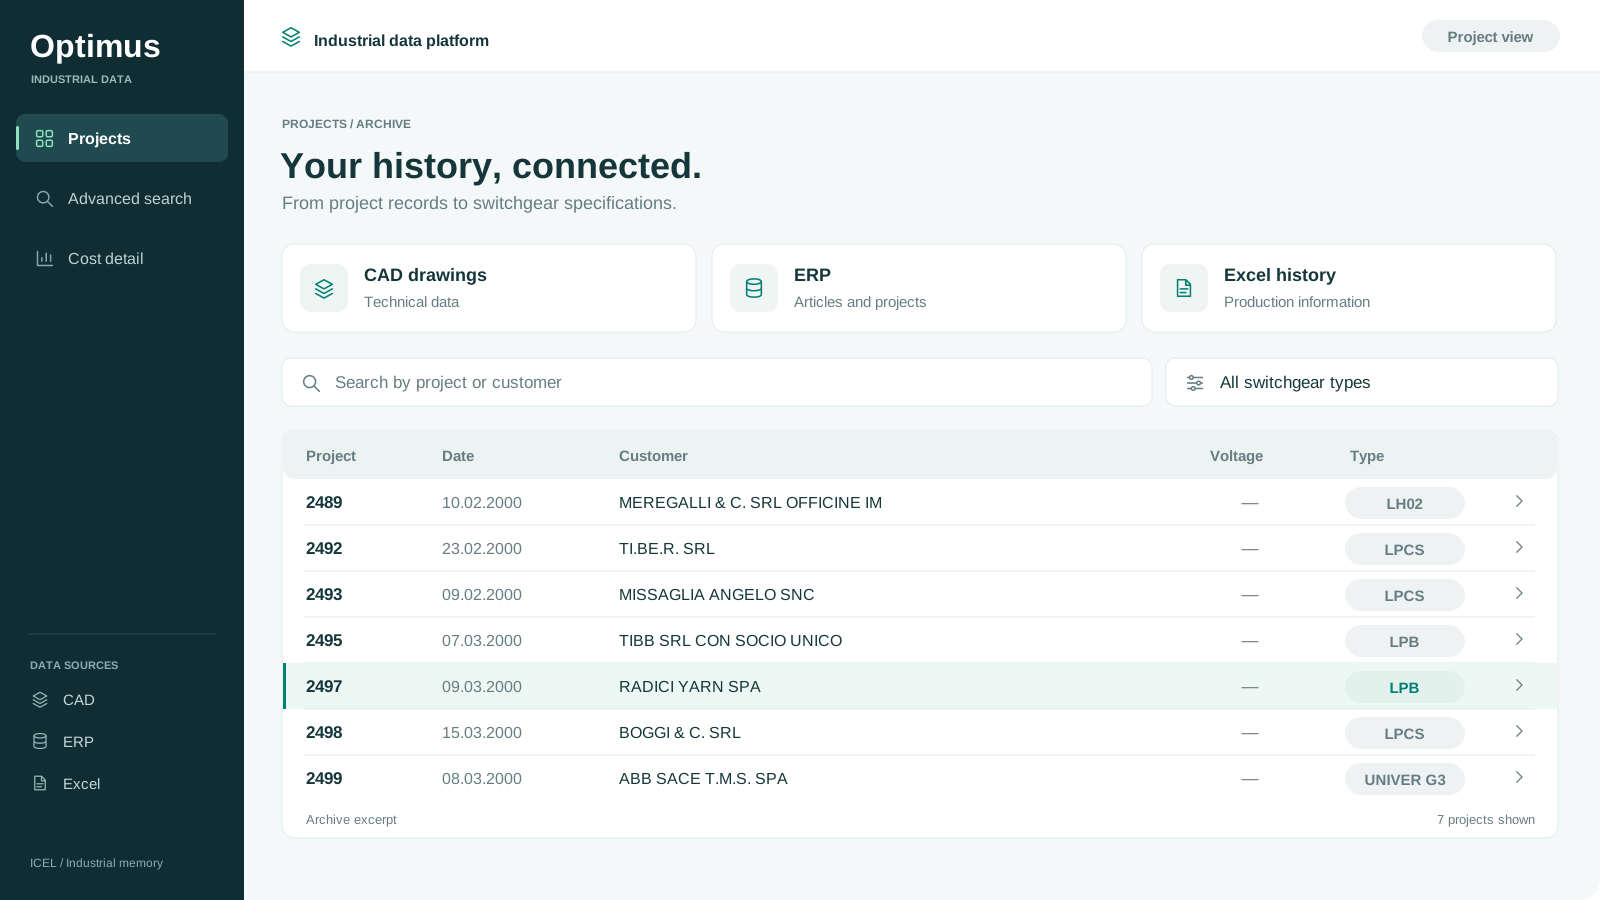
The archive brings together project number, date, customer and switchgear type. Information previously scattered across different sources enters one view.
Find the previous project to build on.
Business and technical filters narrow down the archive by customer, project, low or medium voltage and electrical property ranges. A foundation for identifying comparable supplies.
From switchgear to component. From estimate to actuals.
The detail expands items and subcomponents and compares quoted, target and actual quantities and values. Economic data is connected back to the supply it describes.
This project was built for ICEL. Explore the company’s transformation.
What we designed.
Data extraction, consistent relationships and an API layer bring together sources with different formats and meanings. This foundation enables historical searches and prepares data for further analysis and estimation models, to be developed and validated in the production context.
Extract from drawings
We developed algorithms to read CAD/DWG files, locate relevant pages through their index and extract technical information. Pattern matching and spatial proximity between entities associate labels with values in tables.
Reconcile the sources
Data extracted from drawings, line items from management software and Excel master records were organised in a PostgreSQL relational database. Job and position references connect technical properties, quantities and financial values.
Make the data queryable
Automated processes on AWS read files from S3, process them and populate PostgreSQL. Python APIs expose filters and search; the React interface brings project history, technical details and cost comparisons into everyday work.
CAD, business systems and Excel
Extraction, PostgreSQL and APIs
Search and comparison
The factory’s memory.Organised to be used.
The value lies in the relationships: find a product, trace it to a job and read its properties, quantities and costs together.
Three sources, one data model.
CAD / DWG drawings
General information and technical properties recovered from product documentation.
- Job and position references
- Descriptions and identifiers
- Technical and construction properties
Management-system data
Item and product-family details, with quantities and values at different stages of the job.
- Quotation
- Job target
- Actuals
Excel archives
Historical master records complete the product context and help connect the documents.
- Date and year
- Customer, location and plant
- Product type and description
From separate archivesto connected data.
Explore how drawings, costs and job history are brought together.
Start with the data already available.
Technical documents and management archives are identified around the questions the business needs to answer.
- CAD / DWG drawings
- Item and job data
- Excel history
A defined set of sources and information to connect.
Turn files into information.
Algorithms read drawings, locate fields and make their contents consistent with the other sources.
- Index and relevant sheets
- Entity pattern matching
- Spatial association of fields
Structured technical properties.
Reconstruct the history of a job.
The relational database connects technical data, master records and values through shared references.
- Job and position
- Items, families and quantities
- Quotation, target and actuals
A shared data foundation in PostgreSQL.
Find the information that matters.
APIs expose filters and attribute-based searches. The designed views put data in the context of the job.
- Technical and descriptive filters
- Search for comparable jobs
- Detail views and value comparisons
Queryable history to support decisions.
The engineering decisions.
From extracting DWG files to the web interface: distinct components connected by one data model.
CAD extraction and attribute-based search
Extraction uses the structure and location of entities in the drawing to produce usable data.
- Index and references
- The algorithm reads the index to identify the sheets containing relevant information.
- Pattern matching
- It recognises the entities to find and uses a spatial nearest-neighbour approach to associate complementary fields.
- Search criteria
- The APIs support multiple filters and similarity searches on structured product and job attributes.
Relational database and access services
The architecture separates file storage, processing and data access.
- AWS S3 and EC2
- S3 stores the files. A process on EC2 reads and processes them, then transfers extracted data to the database.
- PostgreSQL
- Dedicated tables for drawing data, technical job details and master records preserve relationships between the sources.
- Python APIs and React interface
- APIs expose processed data. The interface combines project search, technical filters, item details and comparisons of quantities and values.
Digitalisation preparesthe next step.
Connected data is easier to find, compare and reuse. This foundation supports business analysis and prepares the development of further production-effort estimation models. At ICEL, it is part of a broader journey of process evolution and Super Intelligence adoption.
The figures describe the scope analysed. Predictive effort models are a further development to build and validate on the data foundation.
Questions to start from
- Which past jobs have comparable characteristics to the one we are preparing?
- How do quantities and values change between quotation, target and actuals?
- Which historical data is needed to develop production-effort estimates?
What it makespossible.
- CAD data, business-system items and Excel history connected in one platform.
- Projects searchable by customer, type and electrical characteristics.
- Quoted, target and actual quantities and values readable by item and subcomponent.
- A structured foundation supporting quotes, engineering and new-product research.
Is your manufacturing data still scattered across drawings, management software and Excel?
Is your manufacturing data still scattered across drawings, management software and Excel?
Tell us about your project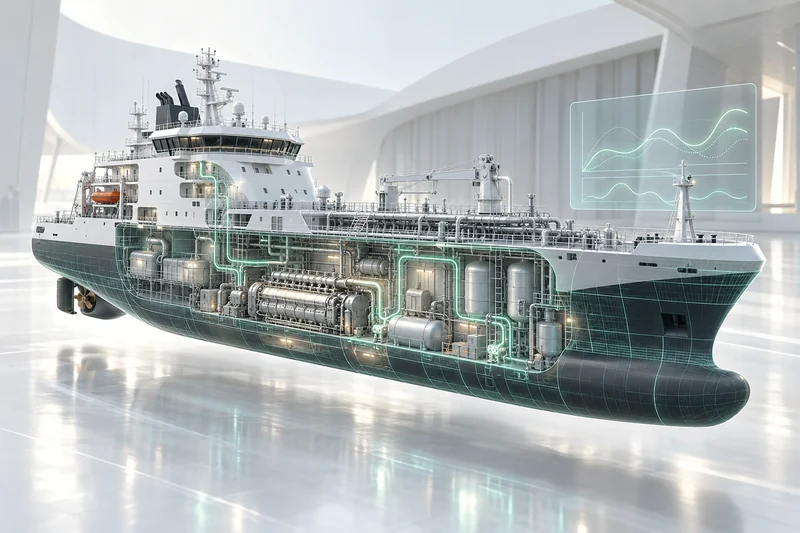
An AI assistant for maritime assets.
Consumption, systems and maintenance. Vessel data becomes a conversation, from onboard sources to the answers people need.