Precision Genomicsfor rare diseases.
From a VCF file to drug-related evidence. A platform connecting genetic variants, conditions and scientific sources.
Biological complexity.A connected perspective.
A laboratory file holds data that can be hard to interpret on its own. We designed a journey connecting sample variants to drug-related evidence, with access to the source behind each association.
- Precision medicine
- Pharmacogenomics
- Knowledge platform
Inside the platform.
Refreshed prototype design, preserving the original text and illustrative interface data.
From sample to evidence.
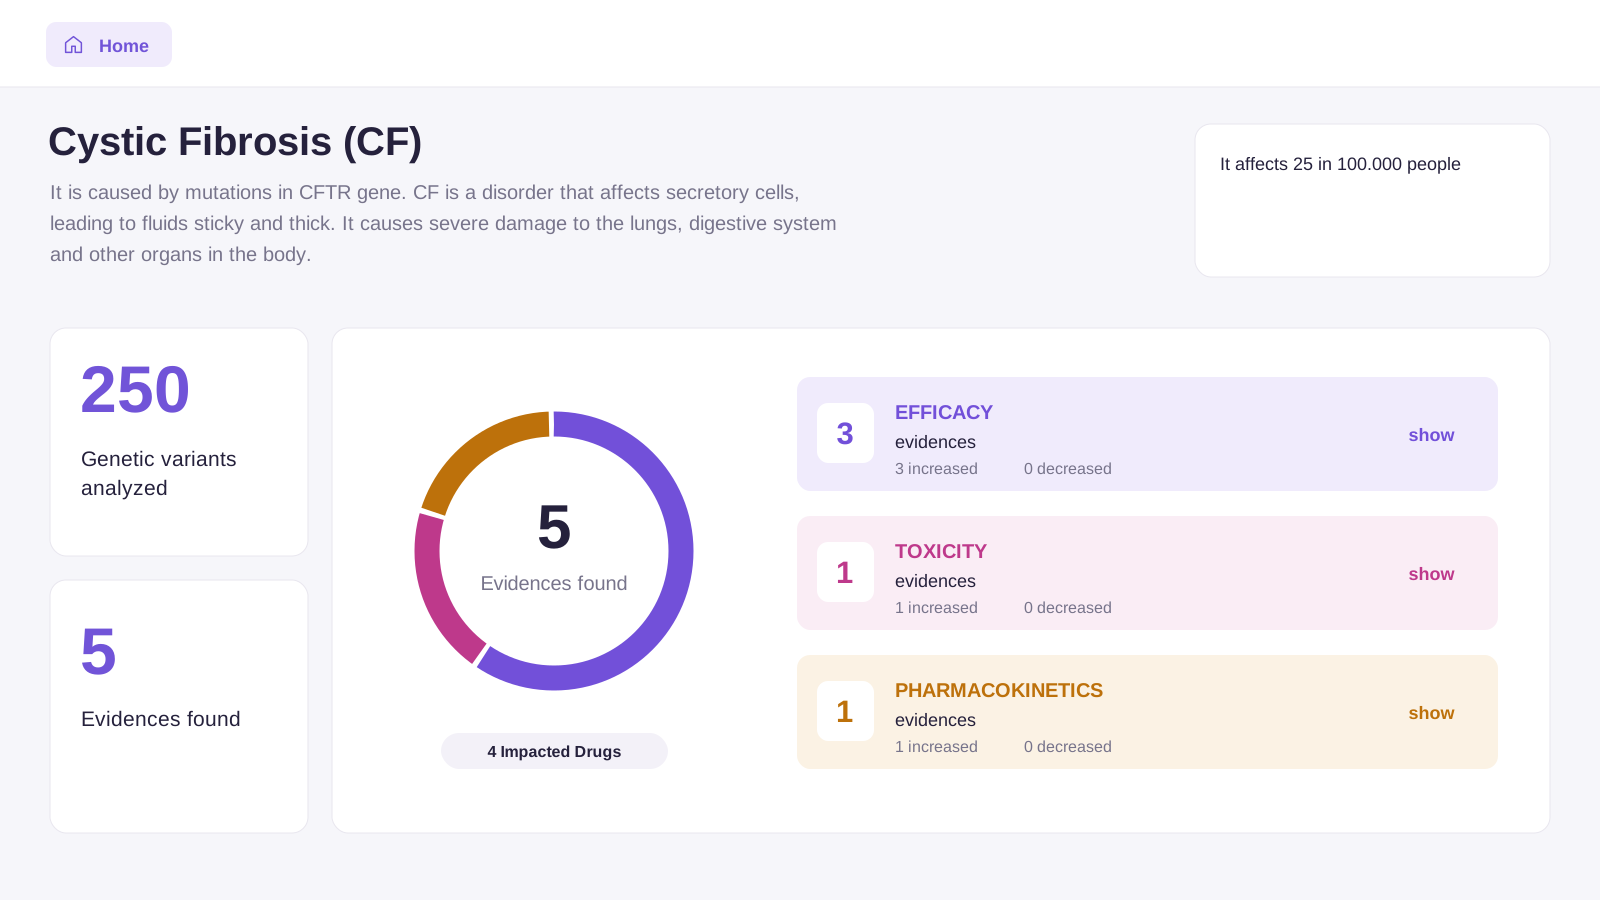
The dashboard brought together analysed variants, available evidence and drugs involved. Three categories opened distinct exploration paths.
A variant. A drug. An effect.
The table paired genetic variant, drug, effect direction and Source. Increased and Decreased described the result reported in the study.
Inside each association.
The record showed Ref and Alt, genotype, gene, condition and drug. Evidence level, description and source made the information traceable.
Explore adverse effects too.
A dedicated view organised toxicity evidence. Effect direction remained linked to the variant, drug and publication.
The context behind a label.
Opening a row revealed genotype, impact, effect and description. The detail let users read Decreased in the context of the evidence.
A third layer of analysis.
This section separated pharmacokinetic evidence from efficacy and toxicity, retaining the same journey from variant to source.
From effect to publication.
The final record brought together genetic data, an effect description and the level of evidence. The source reference completed the journey with the publication to consult.
From the sample.To navigable knowledge.
The platform connected the sample’s genetic profile to available evidence, with views dedicated to the conditions addressed by the project.
The data, the context and the source
The laboratory file
The VCF was the entry point. Variants and genotype informed the exploration journey.
- VCF file
- Variants
- Genotype
Project areas
Rare diseases and autoimmune conditions. The screenshots illustrate the cystic fibrosis journey.
- Cystic fibrosis
- Multiple sclerosis
- Beta-thalassemia
- Fabry disease
- Rheumatoid arthritis
- Psoriatic arthritis
Scientific evidence
Each association included its impact category, effect direction and source.
- Increased / Decreased
- Level of evidence
- Source
It all beganwith a laboratory file.
From a VCF upload to publication details: four steps in the same environment.
The VCF as a starting point.
The laboratory VCF file was uploaded to the platform. Selecting the condition opened the journey through the sample’s variants.
- Laboratory file
- Variants
- Genotype
A genetic profile to connect to the knowledge base.
From sample to associations.
Variants, genes and the condition were connected to drug-related evidence.
- Variant
- Gene
- Condition and drug
An overview of available evidence.
Three categories, one coherent journey.
Efficacy, toxicity and pharmacokinetics organised the journey. Increased and Decreased indicated the direction of the reported effect.
- Efficacy
- Toxicity
- Pharmacokinetics
Tables and records to investigate each association.
From evidence to publication.
The detailed record exposed genotype, level of evidence, description and study reference.
- Genotype
- Level of evidence
- Source
A connection to the scientific source.
Three ways to explore the evidence.
The three categories separated different questions about the relationship between variants and drugs.
Efficacy
Evidence about drug response, organised by genetic variant.
- Variant and drug
- The table paired the variant identifier with the drug associated in the study.
- Increased / Decreased
- The direction of the effect reported in the evidence: an increase or decrease in the response being considered.
- Further detail
- The record showed genotype, gene, level of evidence and bibliographic reference.
Toxicity
A dedicated view for evidence about adverse effects.
- A separate category
- Toxicity evidence was kept separate from efficacy evidence.
- Effect direction
- Increased and Decreased described the direction of the reported association, read in the context of its study.
- From overview to detail
- Each table row led to a description of the evidence and its source.
Pharmacokinetics
Evidence about how a drug behaves in the body.
- Variant, gene and drug
- The view connected genetic data to the drugs considered in the evidence.
- Reported effect
- The record showed effect direction and a description of the study result.
- Traceability
- The Source reference provided a route back to the associated publication.
What we designed.
The value was making the connection between a genetic finding and the literature navigable: an overview to orient the user, records to investigate and sources to verify.
Import the genetic profile
The journey began by uploading the laboratory’s VCF file, containing sample variants and genotype information.
Organise the evidence
The platform connected variants, genes, conditions and drugs. Evidence was organised into three views: efficacy, toxicity and pharmacokinetics.
Open the details and source
Each record showed the variant, genotype, gene, drug, reported effect, level of evidence and study reference.
Laboratory VCF file
Variants connected to evidence
Dashboard, records and sources
A useful overview.A reachable source.
The dashboard helped users navigate the evidence. Tables let them select an association. Records showed details and scientific references, keeping the exploration journey connected.
Questions made accessible
- Which evidence is associated with the sample’s variants?
- Which drugs and impact categories are involved?
- What does Increased or Decreased mean in that study?
- What is the level of evidence, and where can I read the source?
What it makespossible.
- A journey from a VCF file to evidence associated with its variants.
- Efficacy, toxicity and pharmacokinetics explored in one platform.
- Details on genotype, drug, effect direction and level of evidence.
- Study references accessible from individual records.
From your scientific data.To new research possibilities.
Have scientific data you want to turn into an analytical platform?
Tell us about your project
Customer engagement in Web3.
NFT collections, exclusive access and redeemable products. AI generation and blockchain integrated into the brand’s website and e-commerce.